Image Map Image Map


Ice Velocity

Sentinel-1 Near Real Time Ice Velocity

This is the CPOM ice sheet outlet glacier velocity service. Through this data portal, we distribute frequent maps of ice velocity for key outlet glaciers of the Antarctic and Greenland ice sheets in near real time. The velocity maps are produced by tracking moving features in synthetic aperture radar data acquired by the European Space Agency's Sentinel-1 satellite.

A full explanation of the methods and data is given in: Lemos, A., Shepherd, A., McMillan,M.,Hogg, A.E., Hatton,E., and Joughin,I.: Ice velocity of Jakobshavn Isbrae, Petermann Glacier, Nioghalvfjerdsfjorden, and Zachariae Isstrom, 2015-2017, from Sentinel 1-a/b SAR imagery, The Cryosphere, 12, 2087-2097, https://doi.org/10.5194/tc-12-2087-2018.

Glacier Selection

Click on the map to select a glacier and show maps and charts of the ice velocity data we have processed so far. Grey shading on the plots is used to indicate the floating part of the glacier.

Click on map or select from list:

Nioghalvfjerdsfjorden Glacier Jakobshavn Isbrae Glacier Petermann Glacier Pine Island Glacier Thwaites Glacier Brunt Ice Shelf

To access the Ice Velocity data products we request that you complete a quick and simple registration form. We will not pass on your details to anyone else.

Please either sign in below, or click here to register.

 Login for Data Downloads

Ice Velocity from Images Pairs: 03.08.2019 to 09.08.2019 :

The start and end of each along-flow transect is identified by a capital and lowercase A respectively, and the start and end of each across-flow transect is identified by a capital and lowercase B. Grey shading on the ice velocity transect plots is used to indicate the floating part of the glacier. The velocity maps are produced by tracking moving features in synthetic aperture radar data acquired by the European Space Agency's Sentinel-1 satellite.

Data Downloads

Please note that data downloads are locked until you login or complete the simple registration form.

Data DescriptionData FormatData SizeDownload Link
Ice velocity map of the extracted region on Pine Island Glacier, from Sentinel-1 data acquired between 03.08.2019 - 09.08.2019 Geotiff 1.48 MB
Ice velocity error measurement, for the extracted region, from Sentinel-1 data acquired between 03.08.2019 - 09.08.2019 Geotiff 1.48 MB
Ice velocity measurements from the along-flow transect, from Sentinel-1 data acquired between 03.08.2019 - 09.08.2019 ASCII text 0.09 MB
Ice velocity measurements from the across-flow transect, from Sentinel-1 data acquired between 03.08.2019 - 09.08.2019 ASCII text 0.18 MB
Radar amplitude image of Pine Island Glacier, from Sentinel-1 data acquired between 03.08.2019 Geotiff 4.10 MB
All data files from Pine Island Glacier, from Sentinel-1 data acquired between 03.08.2019 - 09.08.2019 Geotiff and ASCII text 4.67 MB
All data files from Pine Island Glacier, from the whole time series of available Sentinel-1 data Geotiff and ASCII text 1057.35 MB

If you have any special data requests please get in touch using the contact information below.

Detailed Data Description

Input Satellite Data Specification

Sentinel-1a and 1b Interferometric Wide Swath mode (IWS) Synthetic Aperture Radar (SAR) satellite data is the primary input dataset. Single Look Complex (SLC) data was retrieved freely and openly from the ESA Scientific Data Hub.

Co-registration of the image pairs was performed using orbit information only. Where available, the orbit information provided in the Sentinel-1 satellite metadata has been updated with precise orbit ephemerides provided by the Sentinel-1 Payload Data ground Segment (PDGS). Due to differences in the speed with which the satellite data and precise orbit information can be generated and delivered, some image pairs may have been processed using the standard metadata, rather than the precise orbit information.

Temporal Coverage

Sentinel-1b was launched on 3rd April 2014, however the first scientific quality datasets were acquired in November 2014. The length of the time series of input Sentinel-1 data varies for each ice stream due to differences in the data acquisition planning strategy. The whole archive of available data has been processed for each ice stream up to the present day.

Product Format

Antarctic data has been geocoded using a Polar stereographic projection, with a central meridian of 0.0 decimal degrees, and a central latitude of -71.0 decimal degrees.

Greenland data has been geocoded using a Polar stereographic projection, with a central meridian of -45.0 decimal degrees, and a central latitude of 70.0 decimal degrees.

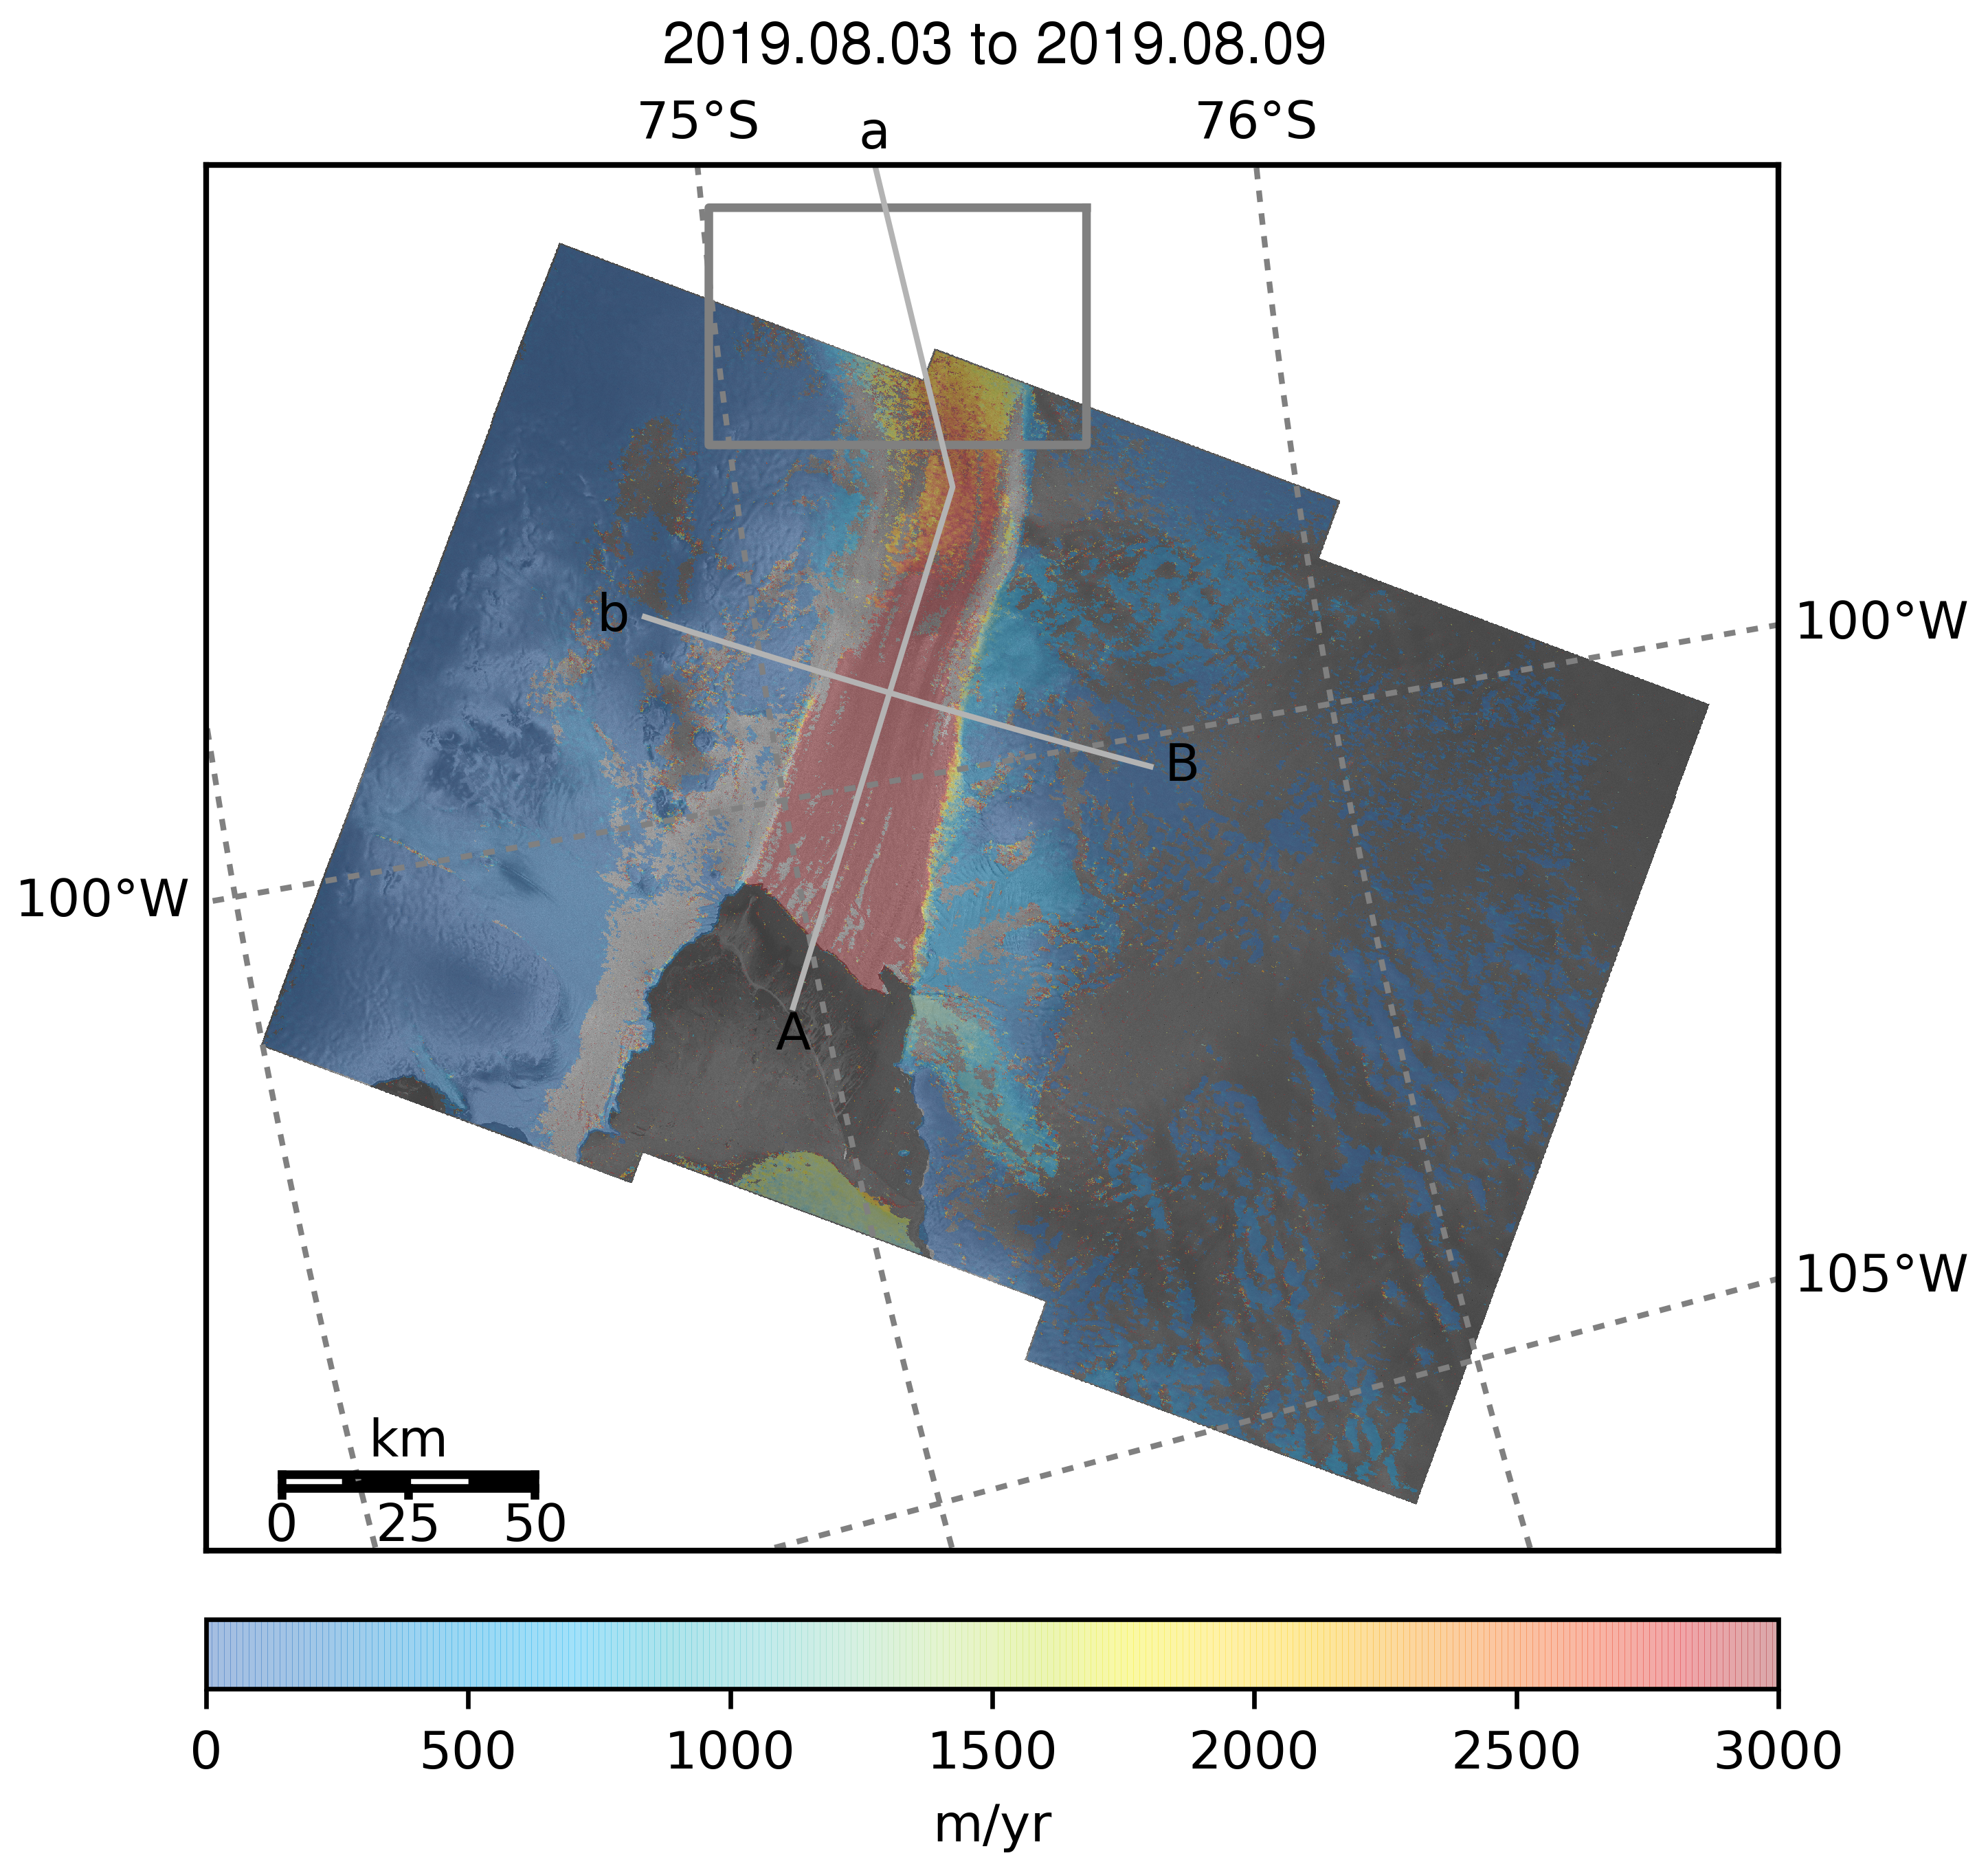
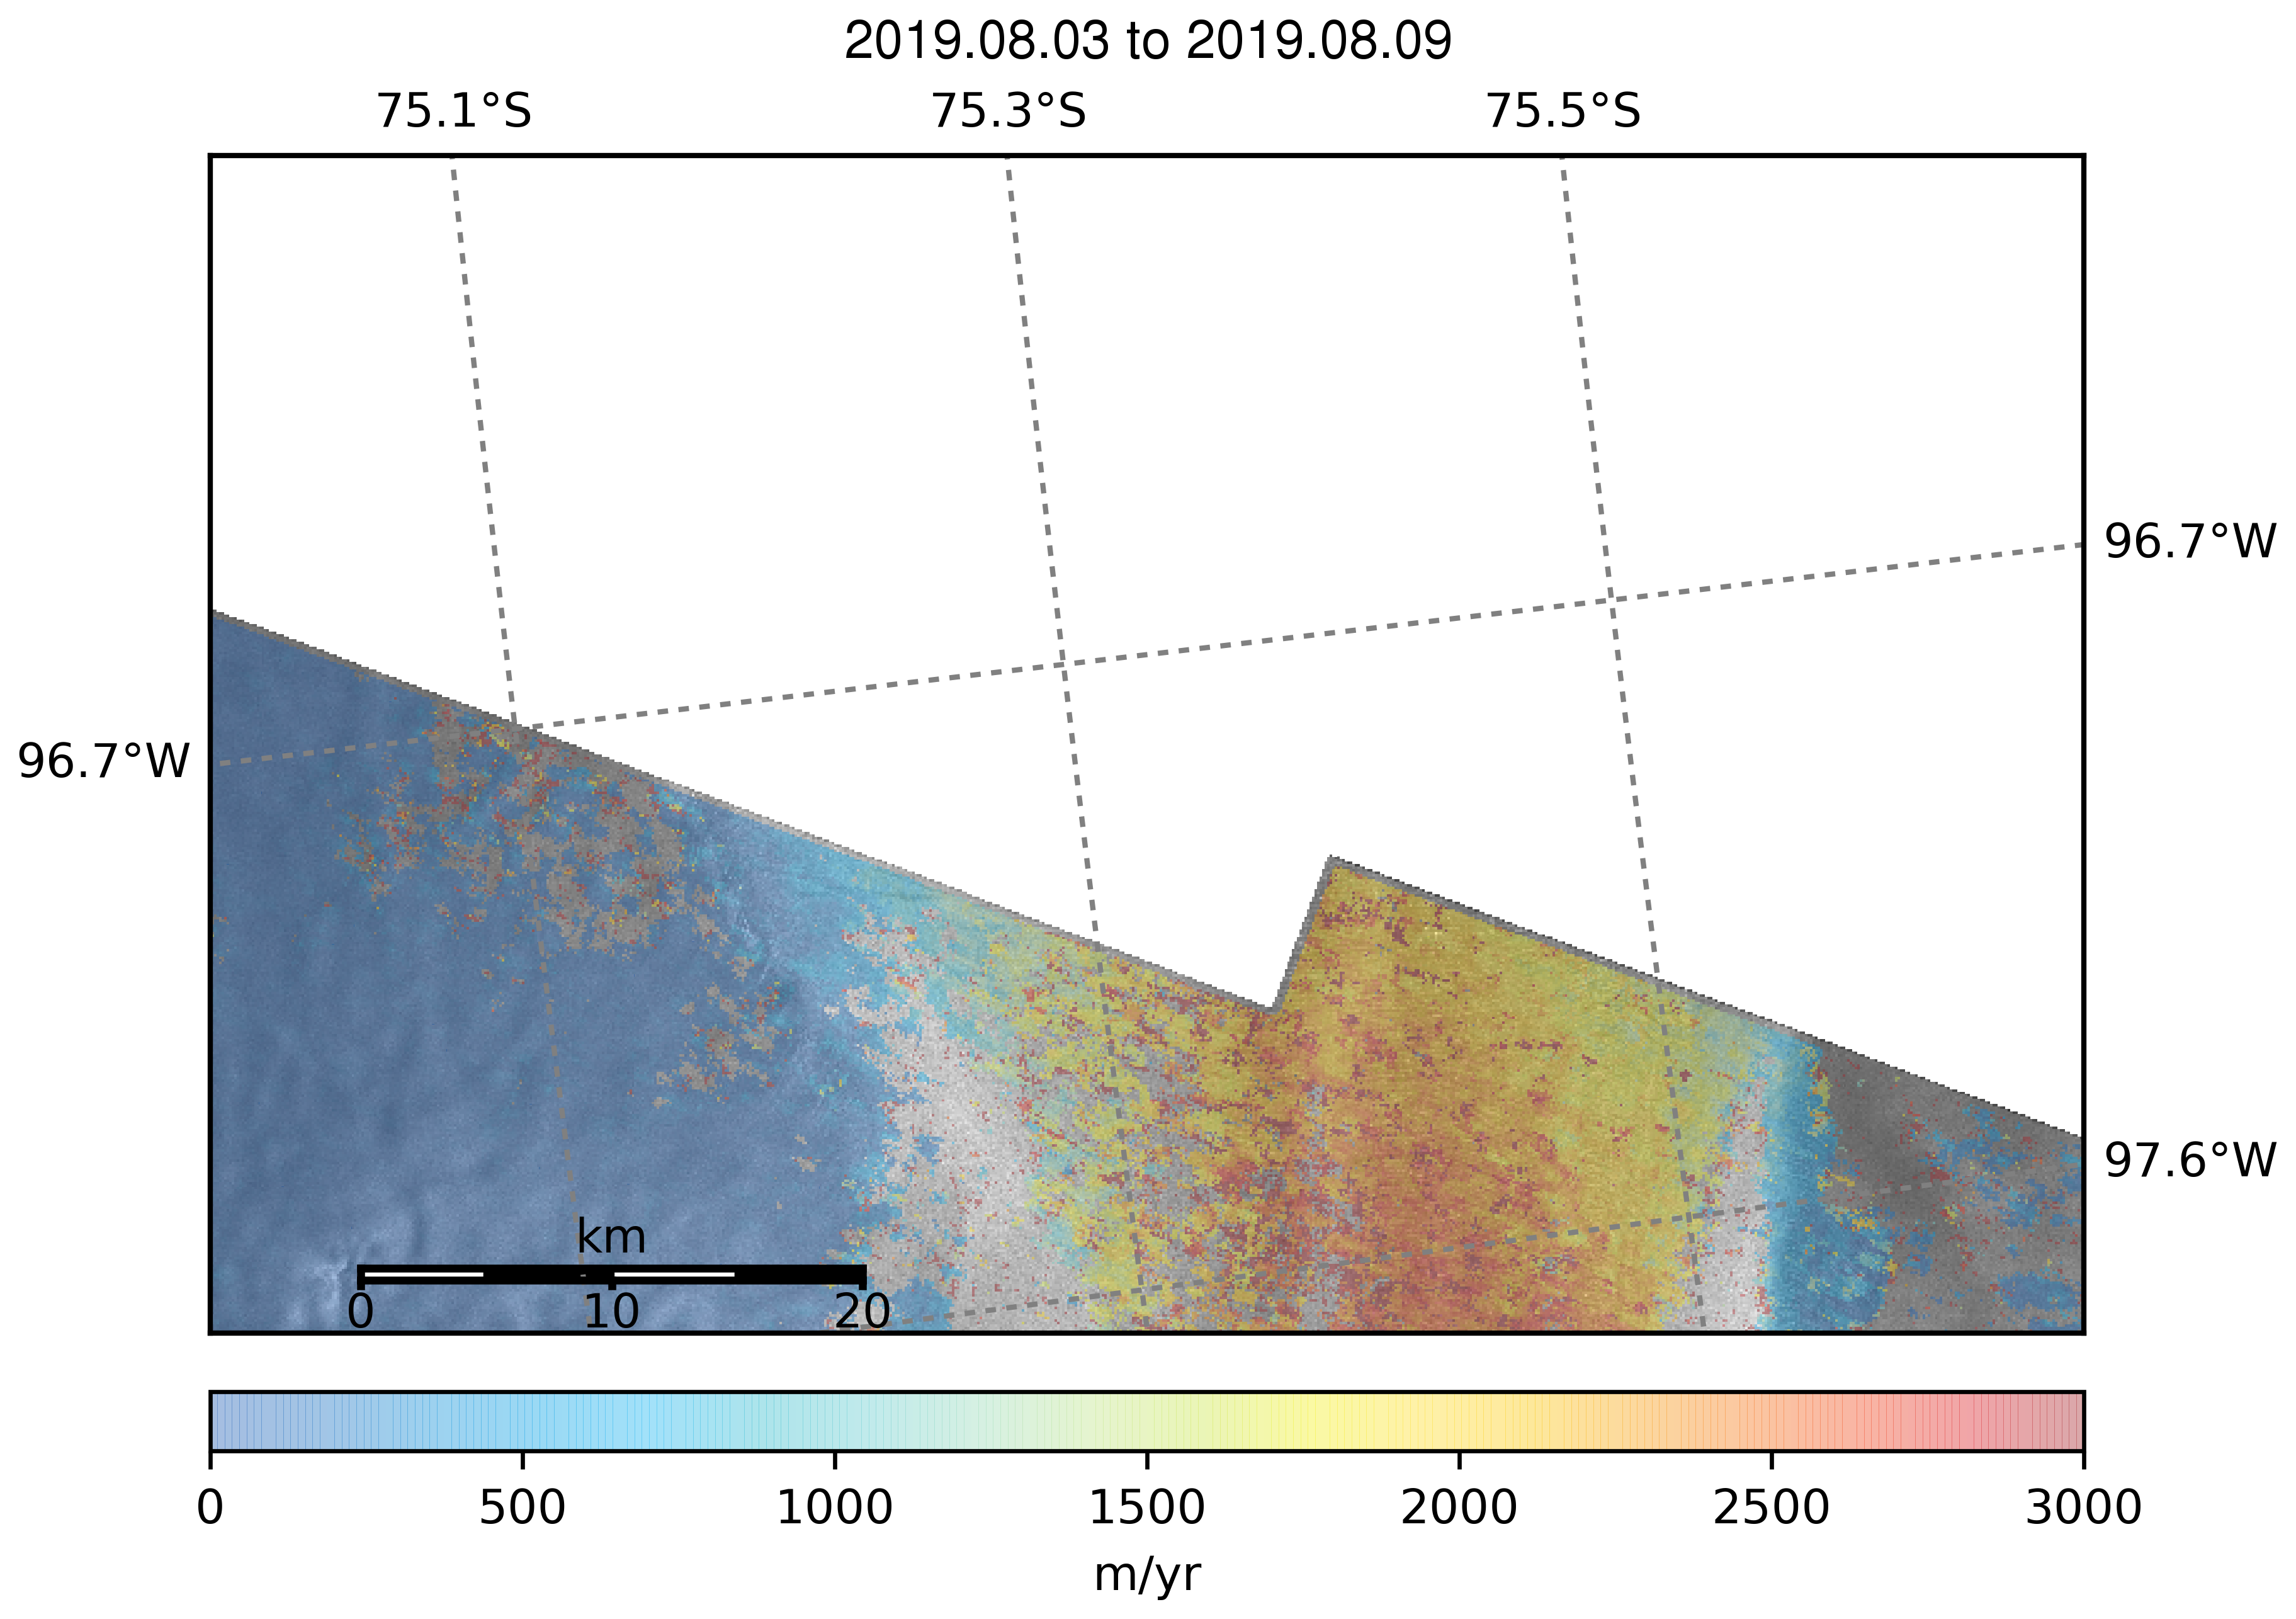
Gridded ice speeds are provided in geotiff format from a smaller extracted area across the central trunk of each ice stream, with a 100 metre by 100 metre grid spacing. 
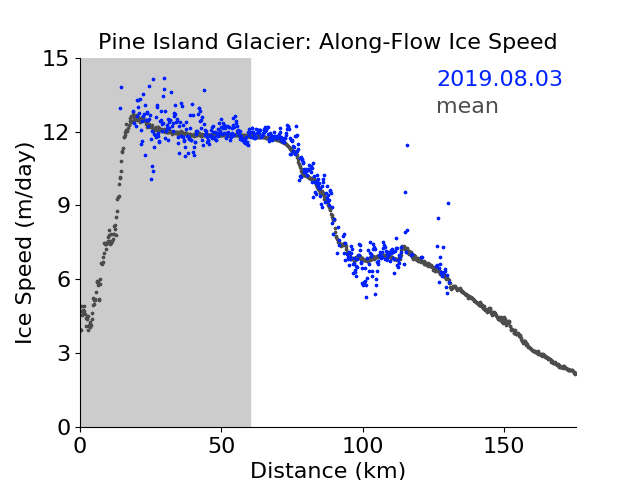
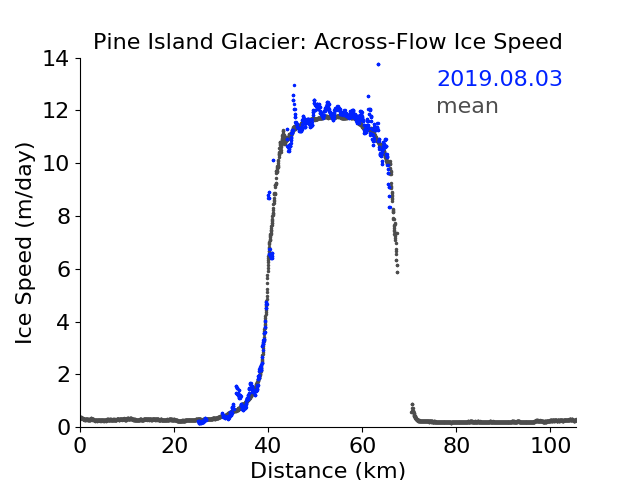
A corresponding error dataset is also provided in geotiff format as a relative measure of the data quality. Ice Speed data extracted from an along flow, and across flow transect from each ice stream is provided as an ascii text files. Columns correspond to: PSx location, Psy location, ice velocity (m/yr), distance along transect (km).

Contacts

We welcome feedback on our products and the website.

For inquiries of a scientific nature, please contact: Dr. Anna Hogg

For inquiries related to web site operations please contact:

Alan Muir at a.muir@ucl.ac.uk

Acknowledgements

These data were generated through a grant from the Natural Environment Research Council (NERC).
Spaceborne Synthetic Aperture Radar (SAR) acquisitions were provided by the European Space Agency (ESA).
The Sentinel satellite missions are designed, launched and operated as a result of close collaboration between ESA, the European Commission, industry, service providers and data users.

Please credit the following reference when using data from this site:

Hogg, A., A. Shepherd, N. Gourmelen (2015) A first look at the performance of Sentinel-1 over the West Antarctic Ice Sheet, FRINGE 2015, Frascati, Italy, 23-27 March 2015.